



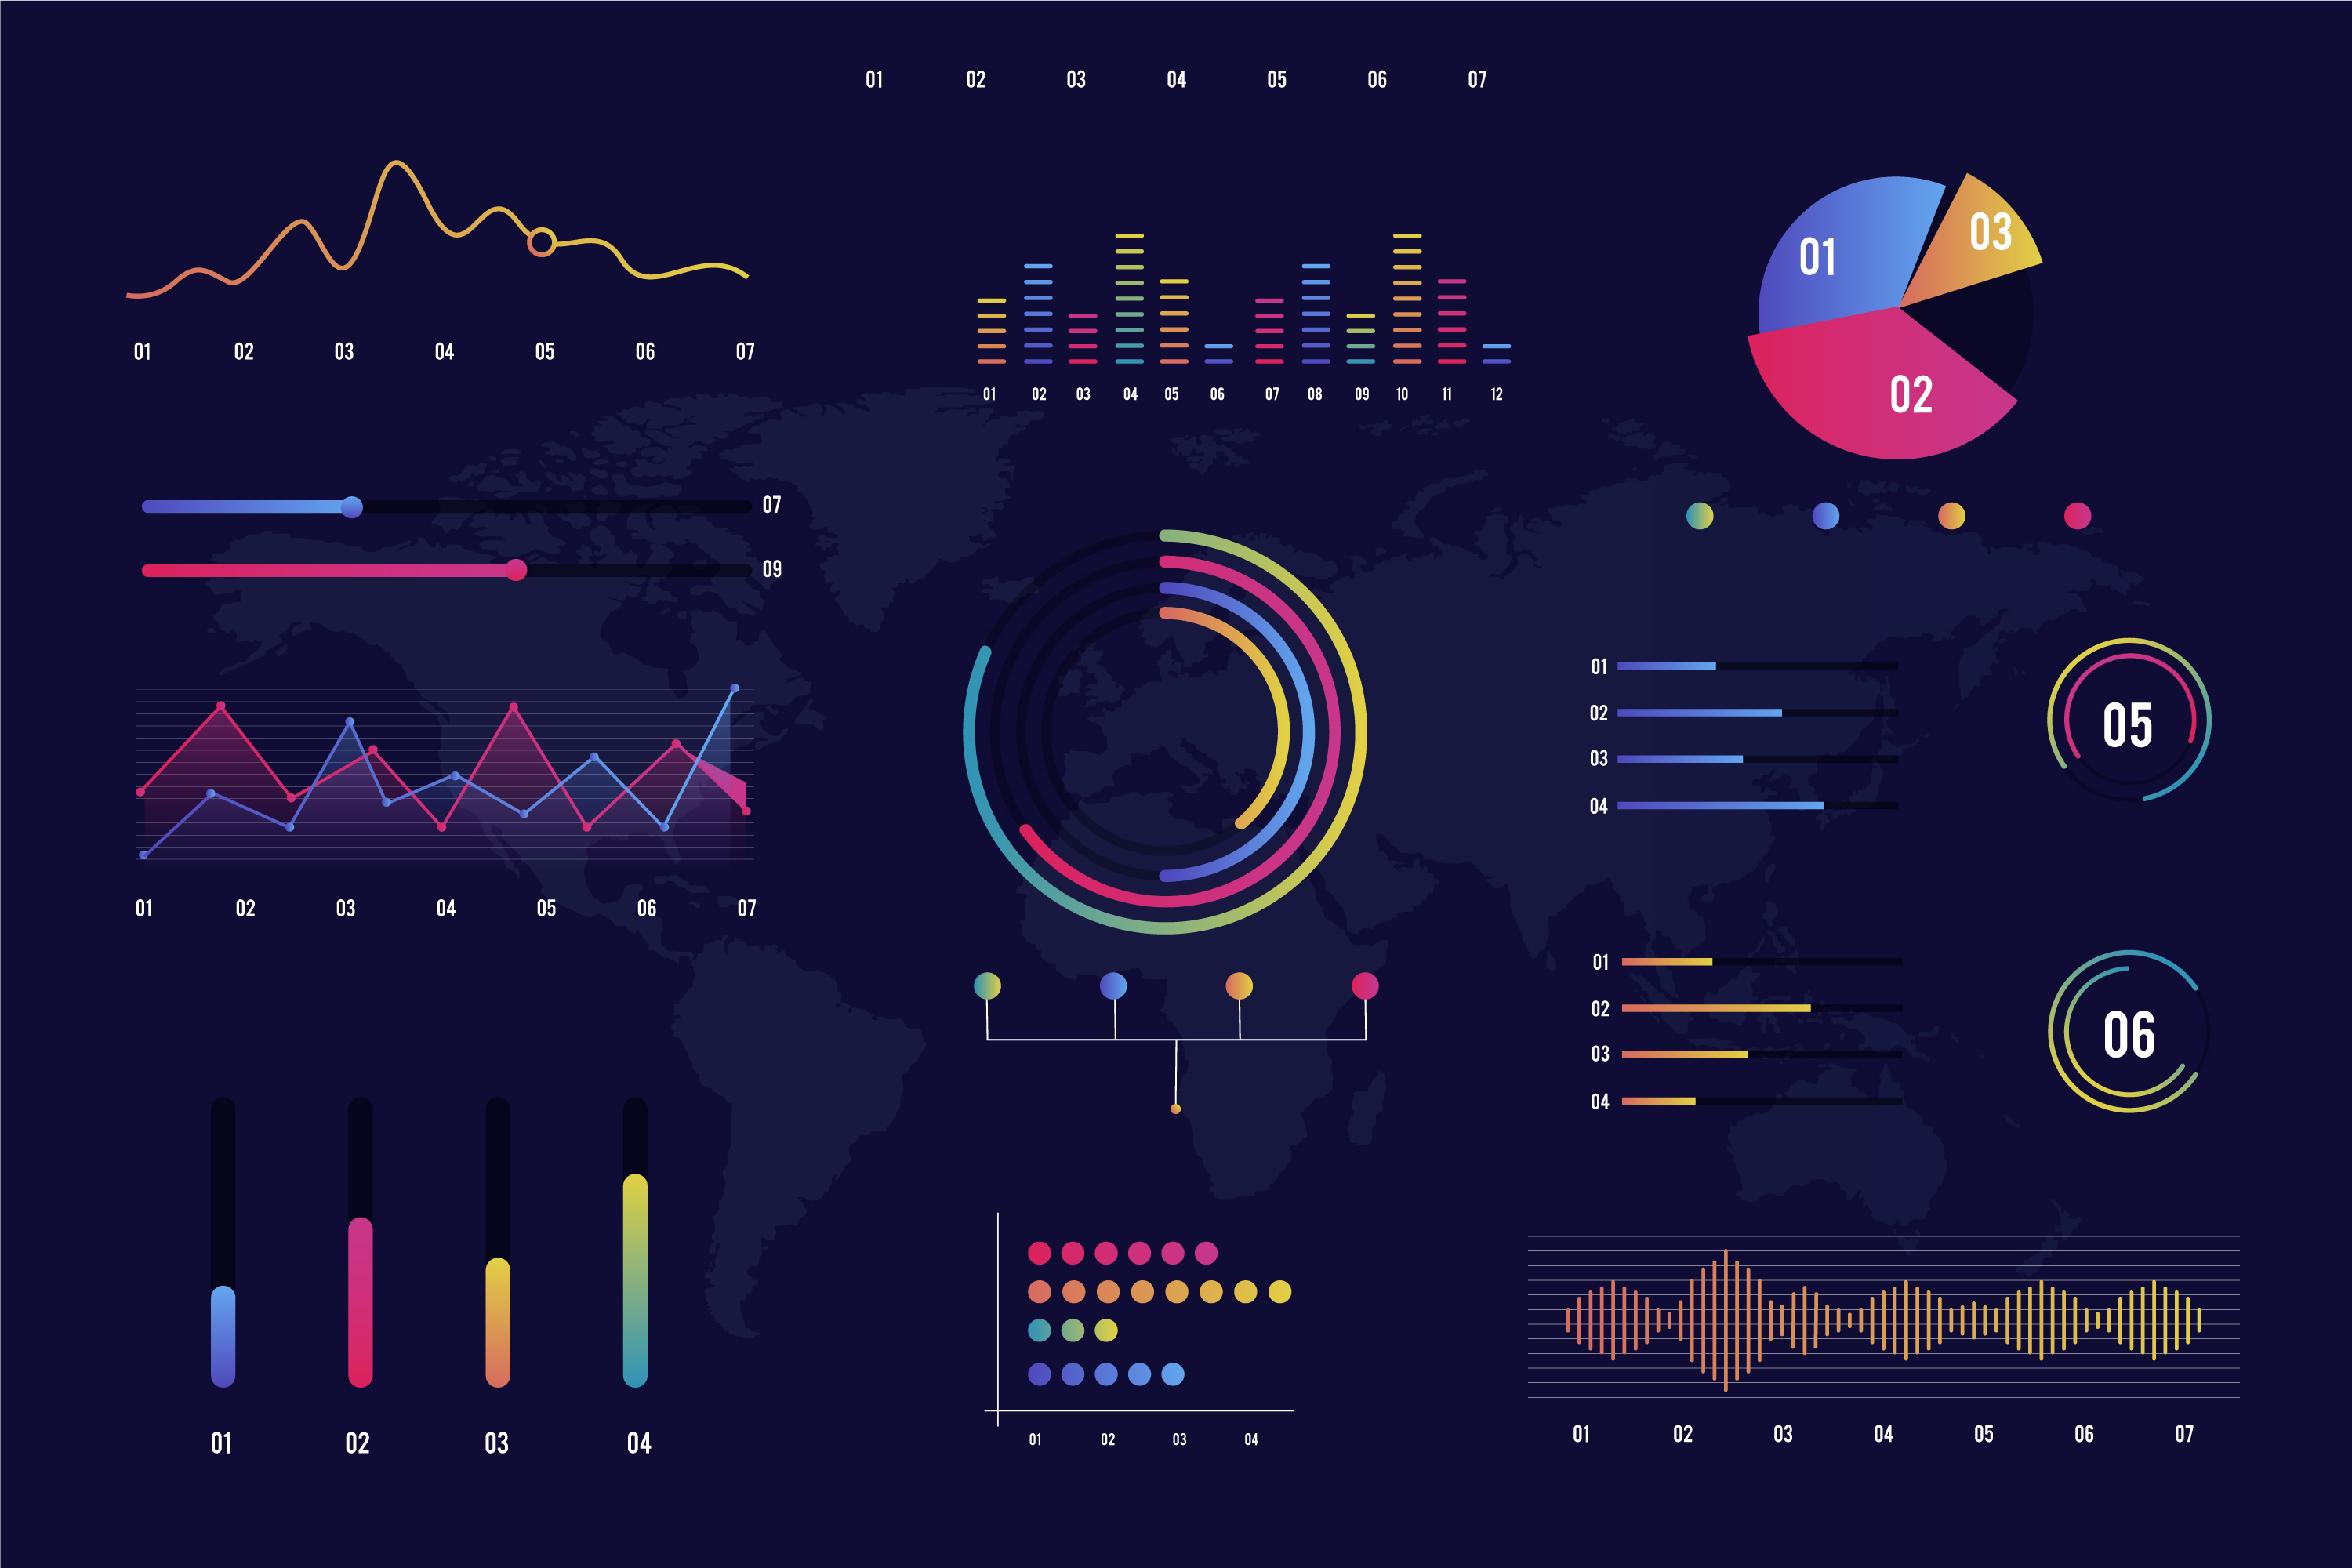
In a time where data influences every aspect of our lives, data visualisation is an essential tool to translate complex data relationships into clear trends, outliers and patterns.
Data visualisation utilises visual elements like charts, graphs, and maps to tell the story behind raw data.
A powerful data visualisation can easily share information, aid in decision making and identify patterns and relationships. Thus, making it a great tool to help businesses make data-driven decisions. However, it can be just as easy to overcomplicate or overdress our charts. As a result, it can lead to our charts conveying an entirely inaccurate message.
Let’s avoid this mishap and instead, unlock the potential of our data with these 5 data visualisation tips below.
1. Start off with the right charts and graphs

Not all graphs and charts are equally effective in presenting your data and conveying its story. To create a powerful data visualisation, the right format is needed to connect to your data’s main purpose. Each format has a type of data that it represents the best. Sometimes even combing related charts can foster a deeper connection with the data’s story and be a better visual representation.
Here are some popular visualisation formats:
Bar charts (or bar graphs) are perfect for comparing different categories within a single measure. They can show data distribution, compare metrics across subgroups, and highlight the highest values. Plus, they’re super popular!
Line graphs are great for spotting trends and changes over time. They connect data points with lines, making it easy to see how values change.
Pie charts are handy for showing parts of a whole or percentages, but they can be tricky when it comes to small differences. The circular shape makes it hard to interpret the size of each section.
Histograms and box plots help you visualize the shape of your data and spot any outliers. Histograms show how often different values occur, while box plots give you a clear view of the median, spread, and any outliers in your data.
Maps are awesome for displaying geographical or location-specific data. There are many types, like heat maps, choropleth maps, dot maps, and flow maps, each with its own flair.
Scatter plots show the relationship between two variables by plotting points on a graph, making them perfect for observing how different factors relate to each other.
2. Enhance data visualizations: cut the clutter

Creating an impactful data visualisation relies on keeping it clean and uncluttered, free of unnecessary elements—also known as "chart junk."
Chart junk includes anything that doesn’t directly add to the understanding of the data, such as excessive gridlines, 3D effects, decorative icons, and distracting colors.
To reduce chart junk, focus on simplicity. Only include elements that support the message you’re trying to communicate. Remove repeating labels, simplify colour schemes, and minimise distractions like borders or backgrounds that draw attention away from the data itself. Thus, by keeping only what’s essential, your visualisation becomes clearer, allowing viewers to quickly grasp insights without unnecessary visual noise.
3. Leveraging colour to bring your data to life

Colour can convey so much information within the first second of looking at a data visualisation. That is how important colour is. Using colour correctly to highlight and accentuate the key points, can quickly improve the readability of your visualisation and improve the data storytelling. On the other hand, using too many colours can cause confusion and misunderstandings.
Just as colour is important, colour choice and colour mapping is important as well. For example, if you are mapping temperatures, use intuitive colours that makes sense to the viewer like blue for cold and red for heat. Therefore, for an effective data visualisation, colour needs to be utilised.
4. Avoid misleading data visualisations

Making sure your data visuals are easy to read and accurate helps your audience get the right message from the start. Sometimes, visuals can be unintentionally misleading, like when a y-axis doesn’t start at zero, making small changes look bigger than they actually are. Or if one data point is sized differently than others.
To keep things clear, try to keep axes proportional, start at zero if it makes sense, and keep scales and labels consistent. Therefore, with a few simple tweaks, your data will be easy to understand, and viewers will get a fair and accurate picture of what you’re showing.
5. Keep it simple

When it comes to data visualisation, simpler is almost always better.
A clean, straightforward chart is much easier for your audience to understand than one loaded with extras.
Avoid cluttering your visuals with too many colours, gridlines, or labels; these can overwhelm viewers and take the focus away from the key message.
Stick to a single, clear takeaway and choose only the most relevant data points to display.
Also, use basic shapes and fonts, and keep the layout spacious to give the data room to breathe. Thus, by stripping away the excess, you allow your data’s story to stand out, making it memorable and easy to follow.
Visualise Your Data with FONSEKA Today!
To wrap it up, creating powerful data visualisations is all about making smart, simple choices. Start with the right chart or graph for your data, and keep things clean by ditching the chart junk and clutter. Use colour thoughtfully to bring attention to where it matters, and make sure everything’s accurate so your visuals aren’t misleading. Above all, simplicity is key—focus on telling a clear story without unnecessary extras.
At FONSEKA, our designers transform your data into powerful visuals for posters, ads, and any marketing materials to capture your audience's attention. Get your data transformed today!